Who Needs Strava Premium When You Have Python?
Building an Activity Heatmap Using Python

If you haven’t already heard, Strava provide a powerful API that allows users to access their data using code. This gives us the ability to create interesting visualisations, analyse progress, and create custom trackers and planners, all with just a few lines of code.
In this tutorial, we’re going to walk through the process of building a heatmap to visualise all of your GPS routes on one map. It’ll show routes you travel frequently, adventures in the middle-of-nowhere, and everything in between. It’s a really cool way to see how much of an area you’ve explored, and find some new routes that connect places you’ve been.

We’ll also see how we can modify this code to only use activities of a specific type, or activities within a certain date range. So if you want to show only your bike rides in a certain year, you can do that too.
[Note: For this tutorial, you will need a Strava Account and a Python environment set up on your machine. Any Python libraries used in this project that you don’t already have installed can be downloaded with pip.]
Getting Started
Let’s start by connecting to the Strava API and requesting an access token. For a full explanation of how to work with the API, check out this article. The code used is shown below:
import os
import requests
import webbrowser
import json
import time
import pandas as pd

# request initial token

redirect_uri = 'http://localhost:8000'

client_id = os.environ['STRAVA_CLIENT_ID']
client_secret = os.environ['STRAVA_CLIENT_SECRET']

request_url = f'http://www.strava.com/oauth/authorize?client_id={client_id}' \
                      f'&response_type=code&redirect_uri={redirect_uri}' \
                      f'&approval_prompt=force' \
                      f'&scope=profile:read_all,activity:read_all'

webbrowser.open(request_url)
code = input('Insert the code from the url: ')

token = requests.post(url='https://www.strava.com/api/v3/oauth/token',
                     data={'client_id': client_id,
                           'client_secret': client_secret,
                           'code': code,
                           'grant_type': 'authorization_code'})
token = token.json()
Now that we can access the user’s account, we can fetch a list of all activities. Each activity contains the following information, stored in a JSON format.
{'resource_state': 2,
 'athlete': {'id': *****,
             'resource_state': 1},
 'name': 'Morning Ride',
 'distance': 4034.0,
 'moving_time': 739,
 'elapsed_time': 739,
 'total_elevation_gain': 49.0,
 'type': 'Ride',
 'sport_type': 'Ride',
 'workout_type': None,
 'id': *****,
 'start_date': '2024-09-06T06:47:09Z',
 'start_date_local': '2024-09-06T06:47:09Z',
 'timezone': '(GMT+00:00) Europe/London',
 'utc_offset': 3600.0,
 'location_city': None,
 'location_state': None,
 'location_country': None,
 'achievement_count': 0,
 'kudos_count': 0,
 'comment_count': 0,
 'athlete_count': 1,
 'photo_count': 0,
 'map': {'id': '******',
         'summary_polyline': '***********************',
         'resource_state': 2},
 'trainer': False,
 'commute': False,
 'manual': False,
 'private': True,
 'visibility': 'only_me',
 'flagged': False,
 'gear_id': None,
 'start_latlng': [****************, *****************],
 'end_latlng': [*****************, *****************],
 'average_speed': 5.459,
 'max_speed': 10.002,
 'has_heartrate': False,
 'heartrate_opt_out': False,
 'display_hide_heartrate_option': False,
 'elev_high': 117.2,
 'elev_low': 96.2,
 'upload_id': *************,
 'upload_id_str': '*************',
 'external_id': 'stripped_garmin_ping_*************',
 'from_accepted_tag': False,
 'pr_count': 0,
 'total_photo_count': 0,
 'has_kudoed': False}
As you can see, there’s a lot of data fields here, but the ones we’re interested in are the type , start_date , start_latlng and map[summary_polyline].
Let’s now import a list of all activities and extract these data fields from the results. We’ll also save some other fields too such as distance, duration, activity name and ID, just in case we need them later.
# import all user activities

activities = []
page = 1
response = []

while True:

    # request new page of activities
    endpoint = f"https://www.strava.com/api/v3/athlete/activities?" \
                  f"access_token={token['access_token']}&" \
                  f"page={page}&" \
                  f"per_page=50"

    response = requests.get(endpoint).json()

    # check if page contains activities
    if len(response):

        # retrieve some fields for each activity
        # you can see the full list of fields by looking at the response json above
        activities += [{"name": i["name"],
                "distance": i["distance"],
                "type": i["type"],
                "sport_type": i["sport_type"],
                "moving_time": i["moving_time"],
                "elapsed_time": i["elapsed_time"],
                "date": i["start_date"],
                "polyline": i["map"]["summary_polyline"],
                "map_id": i["map"]["id"],
                "start_latlng": i["start_latlng"]} for i in response]
        page += 1

    else:
      break

# convert our activities to a DataFrame
df = pd.DataFrame(activities)
This is a snippet of what our database will look like, some rows and columns have been hidden.

Let’s now start filtering our activities. We need to show only ones that have a GPS map. To do this, we will look at the start_latlng field. If there is some GPS data, we’ll have a set of coordinates here, if not, it will be an empty array.
# remove activities with no gps data
a = df.loc[ df["start_latlng"].str.len() != 0 ]
Next, we’ll filter for a specific date range. For example, to select all activities from 2023, we filter for dates after 31st December 2022 and before January 1st 2024.
# filter by date range - all activities from 2023
b = a.loc[ (a['date'] > '2022-12-31') & (a['date'] < '2024-01-01')]
Finally, we’ll filter for only runs, walks and hikes. We can do this in a similar way to before, but using the type column in our database.
# filter by activity type - only runs, hikes and walks
c = b.loc[ (b["type"] == "Run") | (b["type"] == "Hike") | (b["type"] == "Walk")]
Polylines
Now we have all of our activities collected and filtered, we can start extracting the GPS data. You may notice that there is no GPS file or even coordinate list contained within an activity. Instead, we use something called a polyline.
Polyline is a compression algorithm developed by Google to store a series of GPS coordinates as a Unicode string. It is a form of lossy compression, so it is not quite as accurate as the original GPS file, however, it will be more than sufficient for this project.
It’s also important to note that if you have a privacy zone set up on your Strava account (to hide the start and finish of your activity, or an area around your house) then that information will not be included in the polyline.
The details of the polyline algorithm can be a little complicated. Luckily, there is already a Python library that can help us work with a polyline string. This library can be downloaded using pip. With it, we take a polyline string from our database, and decode it to produce a list of coordinate points.
import polyline
coords = [polyline.decode(i, 5) for i in c["polyline"]] # polyline string
"o`_iIbb|LGe@PeFw@aADcHb@w@jBkA~@sAr@SnD{SK_ABqA{@}BIw@w@sAq@_FL_EhA_KRwDj@u \
DnBeI`FkYPE?c@b@sArAeKn@qCM}AHgDn@yB?]lHwTbLuU^V@_@Fj@n@DH^RBRk@Ao@Q?HS?P?WM \
Rt@n@LVQg@i@l@wAY]c@KJyFlK[t@?\uCxF_BhF_F|NGVKEuAaH_EkAFsBdAqGc@kDkCkG_EqEsB \
cP_AwD{CgJ_F_NeG}OC[ZiBEcGaCoc@c@uBGs@F?cAgAmA{Cg@iEF}B`@cDKsDT{E`@eA~@eELgK \
\oFPuAf@gAn@mCHcHKkCWy@]{E]w@SgB?kB_@..."
# coordinates
[(54.06744, -2.2789),
(54.06748, -2.27871),
(54.06739, -2.27756),
(54.06767, -2.27723),
(54.06764, -2.27577),
(54.06746, -2.27549),
(54.06692, -2.27511),
... ]If you want to explore this in more detail, Google has a free online polyline tool where you can convert coordinates to a polyline, and vice versa.
developers.google.com/maps/documentation/routes/polylinedecoder
Building The Map
The final step is to plot all of these coordinates on a map. Again, there’s a Python library that can help us here: Folium.
The Folium library gives us a free, interactive, zoomable map powered by Open Street Map. It also provides tools to plot lines and points.
We’ll convert our list of coordinates to a Folium object*, then plot those lines on the map. Then we’ll also add the date of the activity as a tooltip, so that is is shown when we hover over a route.
*The folium polyline object does not have a constructor that accepts a polyline string, only a list of coordinates. The added level of indirection is unfortunate.
# Render lines on map
import folium

m = folium.Map(location=coords[0][0], zoom_start=7)

lines = [ folium.PolyLine(locations=coords[i],
                          color='purple',
                          tooltip = c.iloc[i]["date"].split("T")[0],
                          weight=2,
                          smooth_factor=0.1)
           for i in range(len(coords)) ]


for i in lines:
    i.add_to(m)
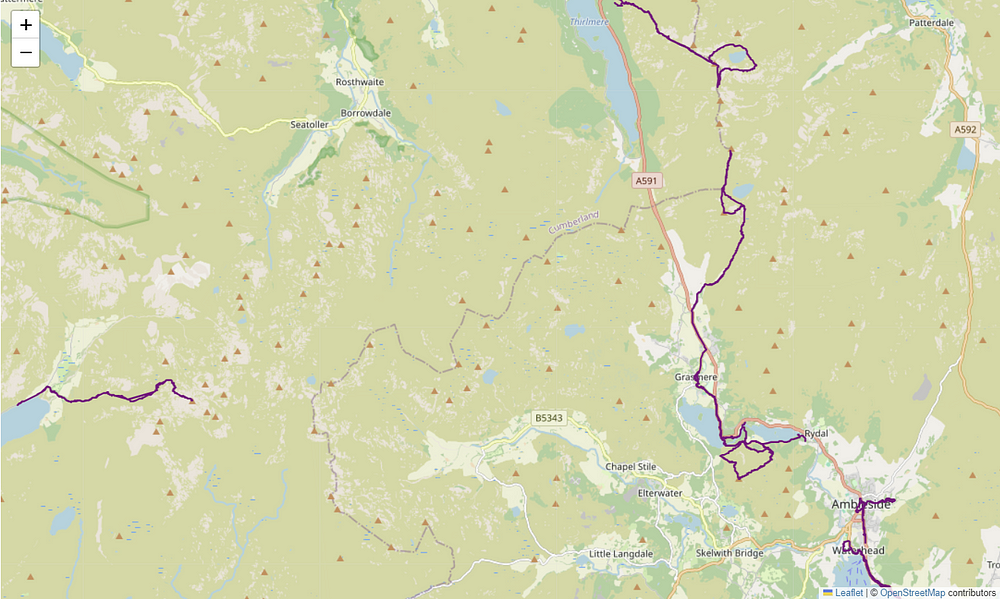
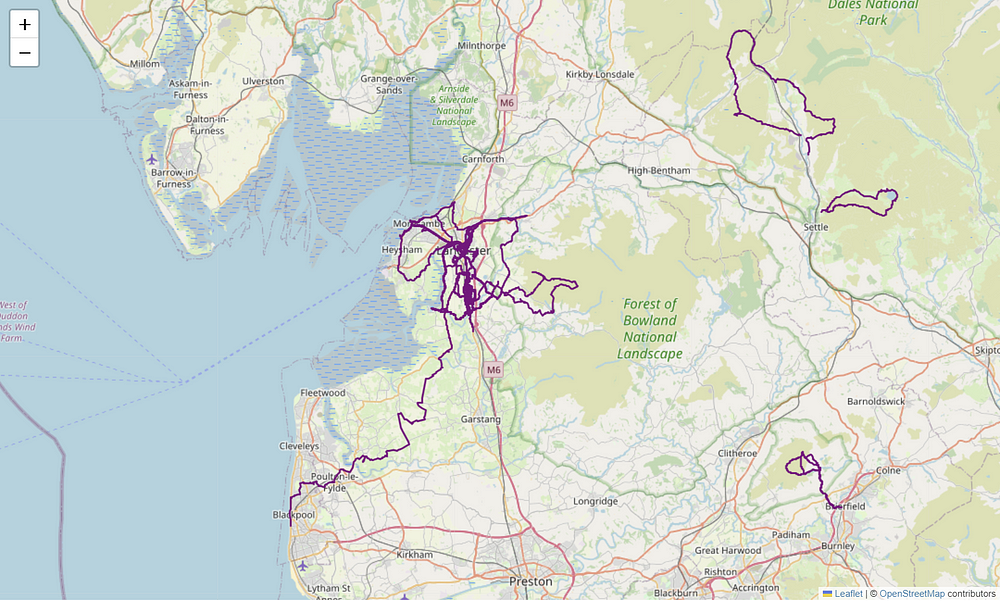
And here’s the completed map:

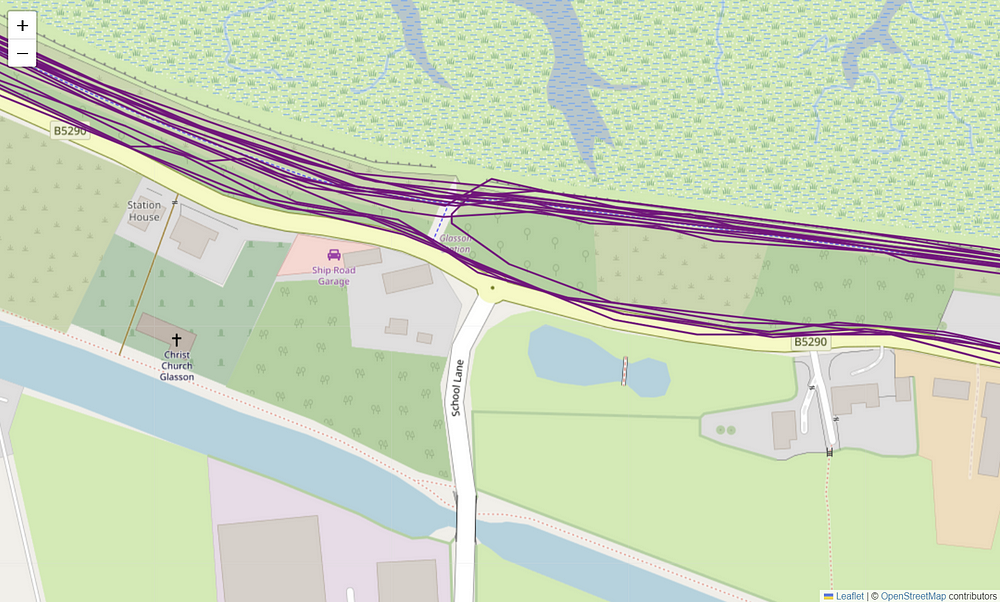
As you can see below when we zoom in, we’re plotting multiple routes on top of each other on the same map. This shows us the paths that are most frequently used, as the lines appear thicker when viewed from further away.

And there we have a fully customisable GPS route heatmap. You can adapt this code to show different time periods and activity types, and customise the map to use different colours and line widths.
You can also use the same techniques of importing and filtering the dataset to build a variety of other applications and tools such as progress trackers and custom leader boards with friends.
Happy coding!

